Nomad/k8s Full Stack Demo
This guide walks through running the S3 Orchestrator demo environment on your local machine. The demo stands up a fully functional instance with three MinIO backends, PostgreSQL, and a complete observability stack (Prometheus, Grafana, Tempo, Loki). Two orchestrators are available: Nomad and Kubernetes (via k3d). Both expose the same functionality — pick whichever you prefer.
Prerequisites
Both demos require:
Nomad demo additionally requires:
- Nomad — runs in
-devmode, no cluster setup needed
Kubernetes demo additionally requires:
Starting the Demo
Clone the repository and run the appropriate Makefile target:
The script builds the container image from source, starts the backing services via Docker Compose, deploys s3-orchestrator into the chosen orchestrator, and waits for the health check to pass. When everything is ready you will see a summary like this:
What Is Running
The demo starts several services behind the scenes:
| Service | Port | Purpose |
|---|---|---|
| S3 Orchestrator | 9000 | S3 API, admin dashboard, Prometheus metrics |
| MinIO 1 | 19000 | First storage backend (10 GB quota) |
| MinIO 2 | 19002 | Second storage backend (10 GB quota) |
| MinIO 3 | 19004 | Third storage backend (10 GB quota) |
| PostgreSQL | 15432 | Metadata database |
| Prometheus | 19090 | Metrics collection (10 s scrape interval) |
| Grafana | 13000 | Dashboard, log exploration, trace viewer |
| Tempo | 3200 | Distributed tracing backend |
| Loki | 3100 | Log aggregation |
| Alloy | — | Log collector (ships container logs to Loki) |
The Nomad demo also starts a Nomad dev agent on port 4646. The Kubernetes demo creates a k3d cluster with a single node.
Demo Configuration
Both demos are pre-configured with:
- Three backends —
minio-1,minio-2, andminio-3, each with a 10 GB quota - Replication factor 2 — every object is automatically copied to a second backend
- Encryption enabled — all objects are AES-encrypted at rest
- Circuit breaker — backends are automatically taken out of rotation after 3 consecutive failures
- Full telemetry — 100% trace sampling, structured JSON logging with trace correlation
- Admin UI — enabled with credentials
admin/admin
The Nomad demo uses pack routing (fills one backend before the next). The Kubernetes demo uses spread routing (distributes evenly across backends). This lets you observe different storage distribution patterns in the dashboard.
Uploading Files
Use the AWS CLI to upload objects through the orchestrator:
Any S3-compatible client works — s3cmd, rclone, mc (MinIO Client), or your application’s S3 SDK.
Admin Dashboard
Open http://localhost:9000/ui/ and log in with admin / admin.
The dashboard provides a real-time overview of the system:
- Storage Summary — total bytes used and capacity across all backends with a progress bar
- Backends Table — per-backend quota usage, object count, and active multipart uploads
- Monthly Usage — API requests, egress, and ingress per backend
- Objects — interactive directory tree; click folders to expand, click files to download
- Configuration — virtual buckets, routing strategy, replication factor, and rate limit status
- Logs — recent structured log output, filterable by severity level
Management Actions
The dashboard also exposes management operations:
- Upload — upload files or entire folders via the browser; supports multi-file selection and preserves directory structure
- Delete — remove individual objects or batch-delete by prefix
- Rebalance — trigger an on-demand rebalance to redistribute objects across backends according to the current routing strategy
- Sync — import pre-existing objects from a backend’s S3 bucket into the orchestrator database (useful when adding a new backend that already has data)
Grafana Dashboard
Open http://localhost:13000 (no login required — anonymous admin is enabled).
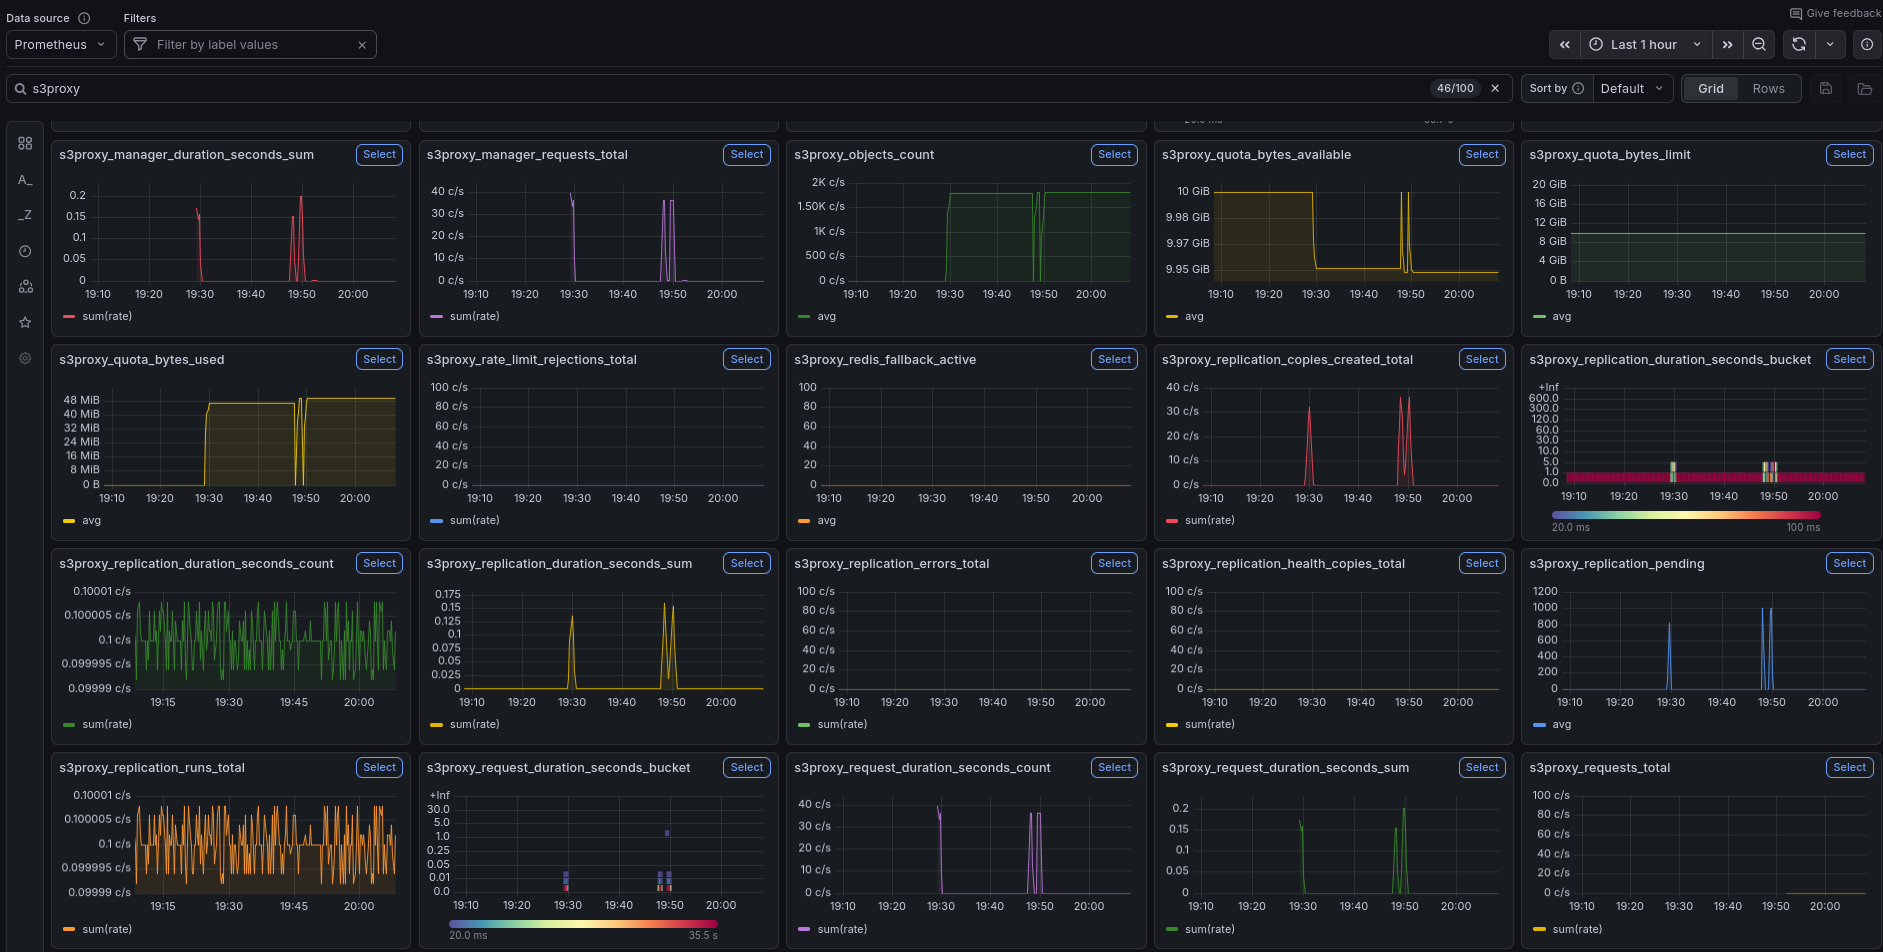
The pre-loaded S3 Orchestrator dashboard is available under Dashboard in the left sidebar. It contains 50+ panels organized into sections. Upload some files and watch the panels update in real time.
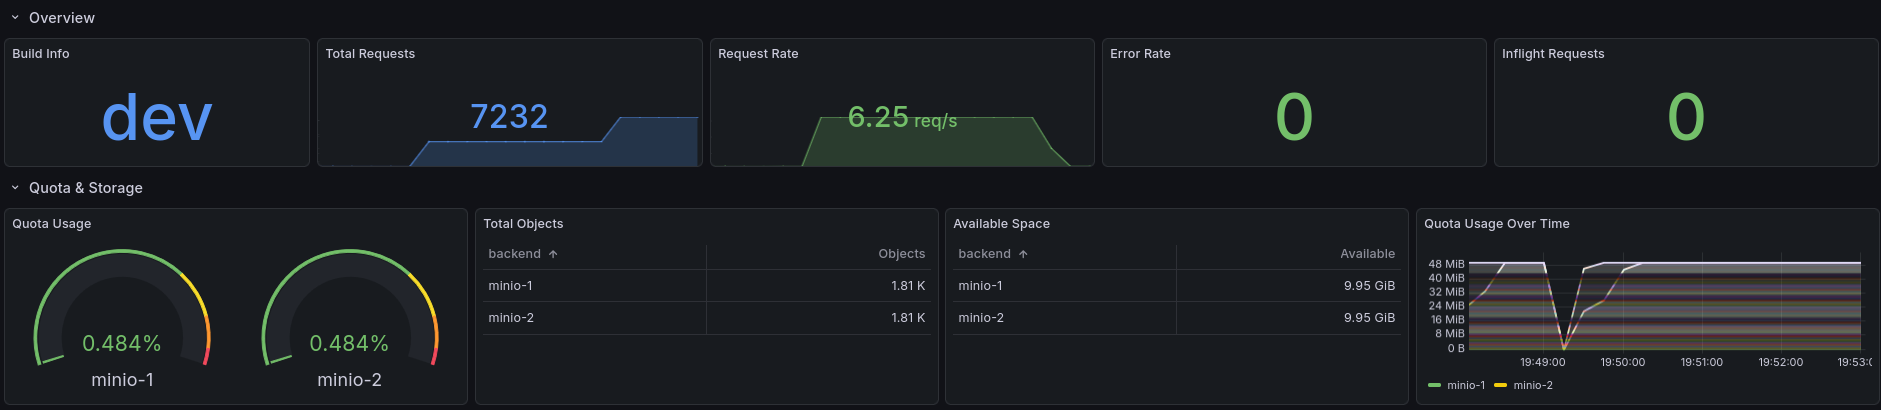
Overview
The top of the dashboard shows build info, total request count, current request rate, error rate, and inflight requests at a glance. Below that, the Quota & Storage section tracks per-backend quota usage over time, total object count, and available space.
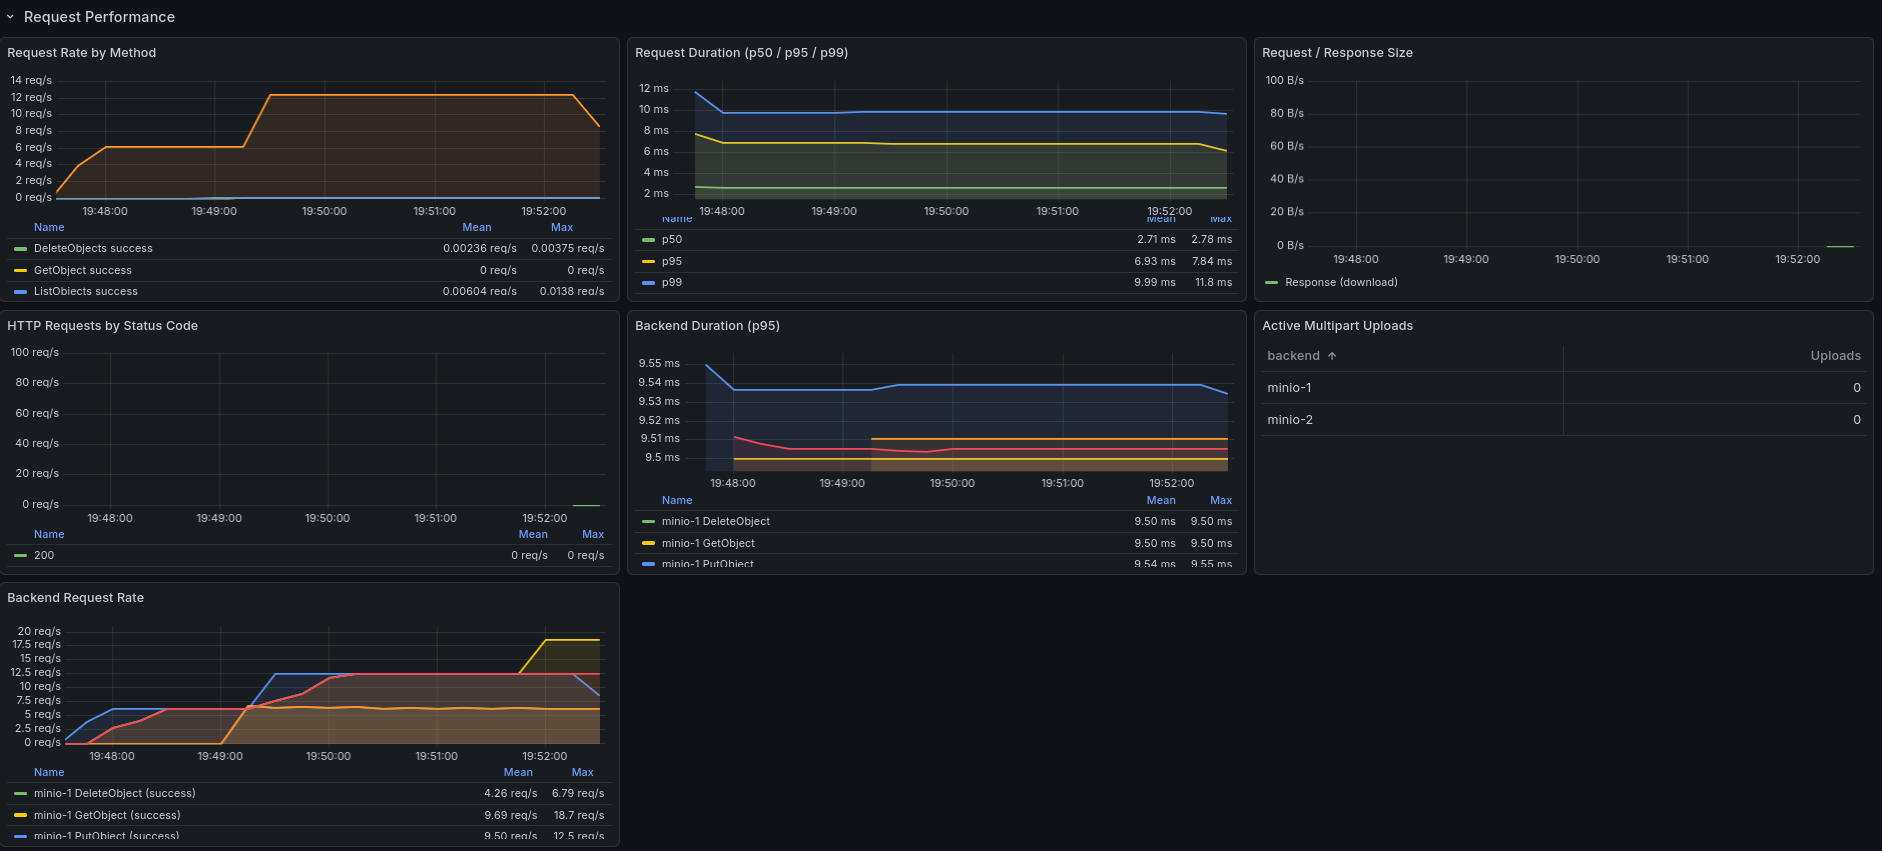
Request Performance
Detailed HTTP-level metrics: request rate broken down by method, duration percentiles (p50/p95/p99), request and response body sizes, and HTTP status code distribution. These panels help identify slow operations and error patterns under load.
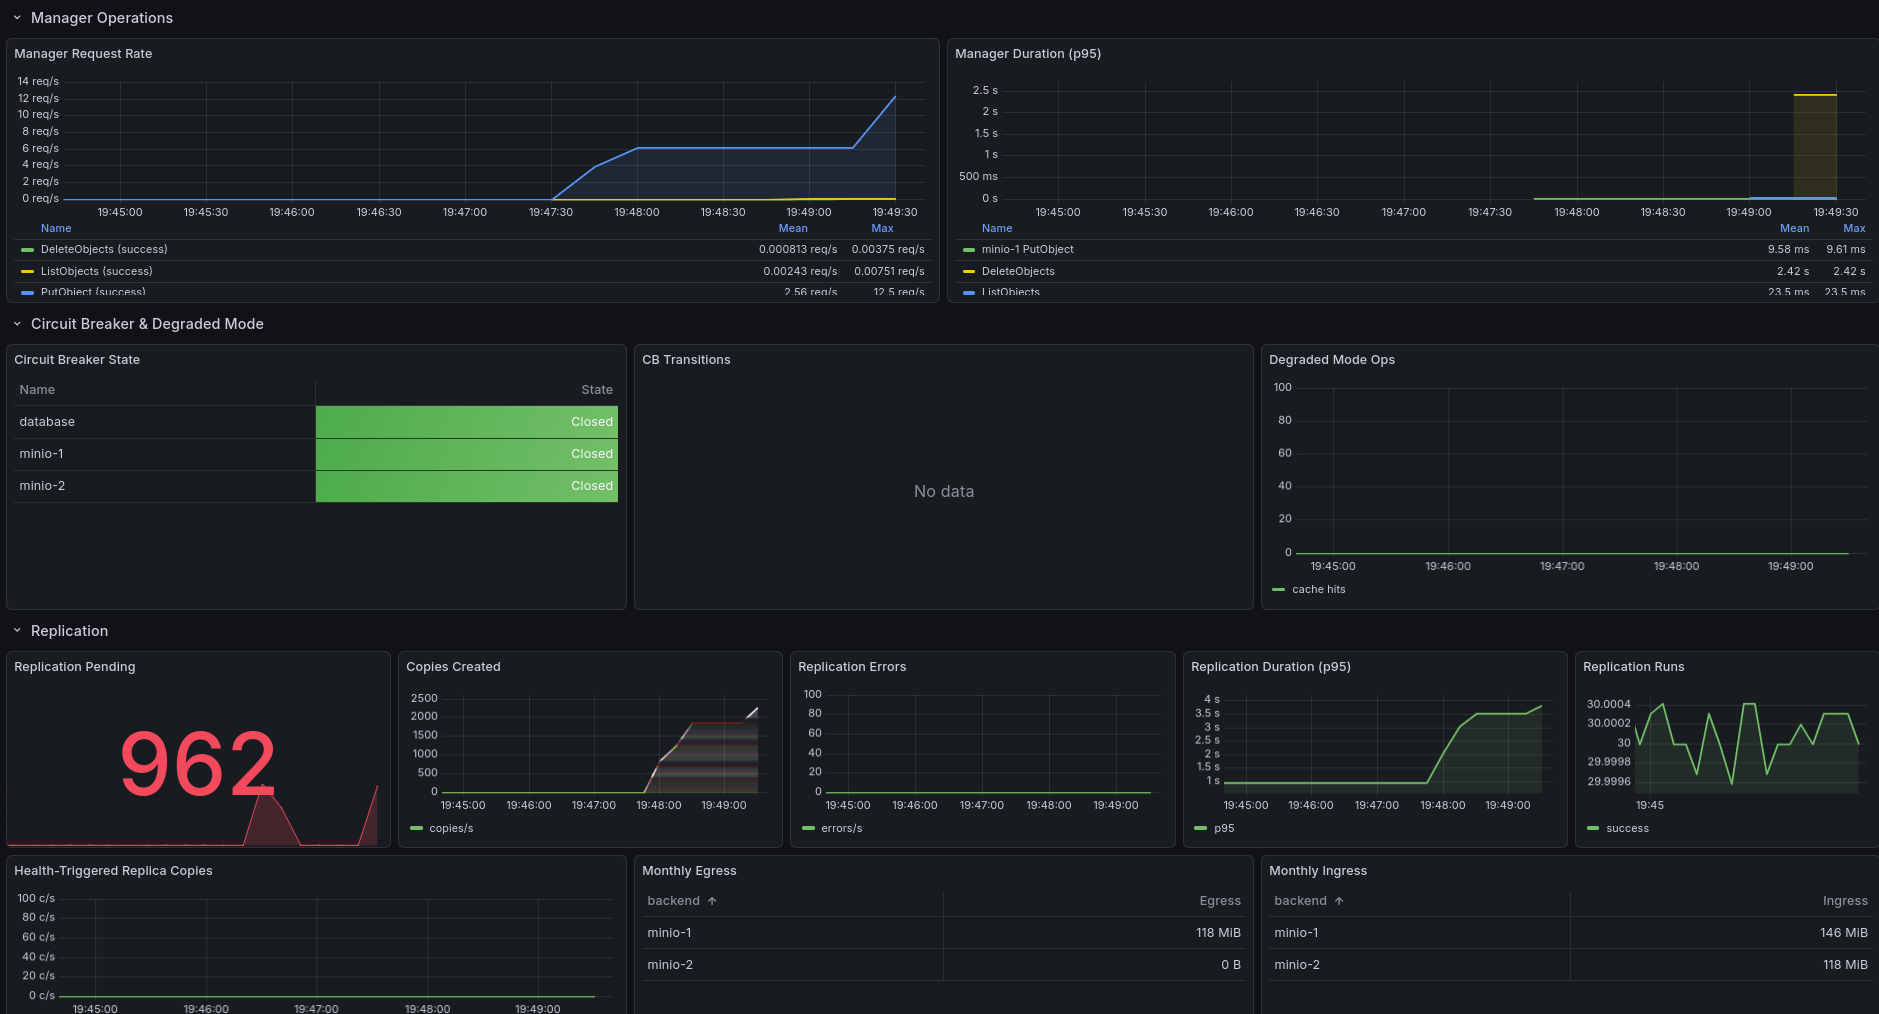
Manager Operations
The backend and manager operations panels show request rate and duration at the storage layer — below the HTTP handler and above the individual S3 backends. This section also displays the circuit breaker status for each backend and the database, replication activity (pending replicas, copies created, errors, duration), rebalancer runs, the cleanup queue depth, and the cleanup DLQ depth (s3o_cleanup_dlq_depth) — a non-zero DLQ means at least one unrecoverable orphan needs operator action.
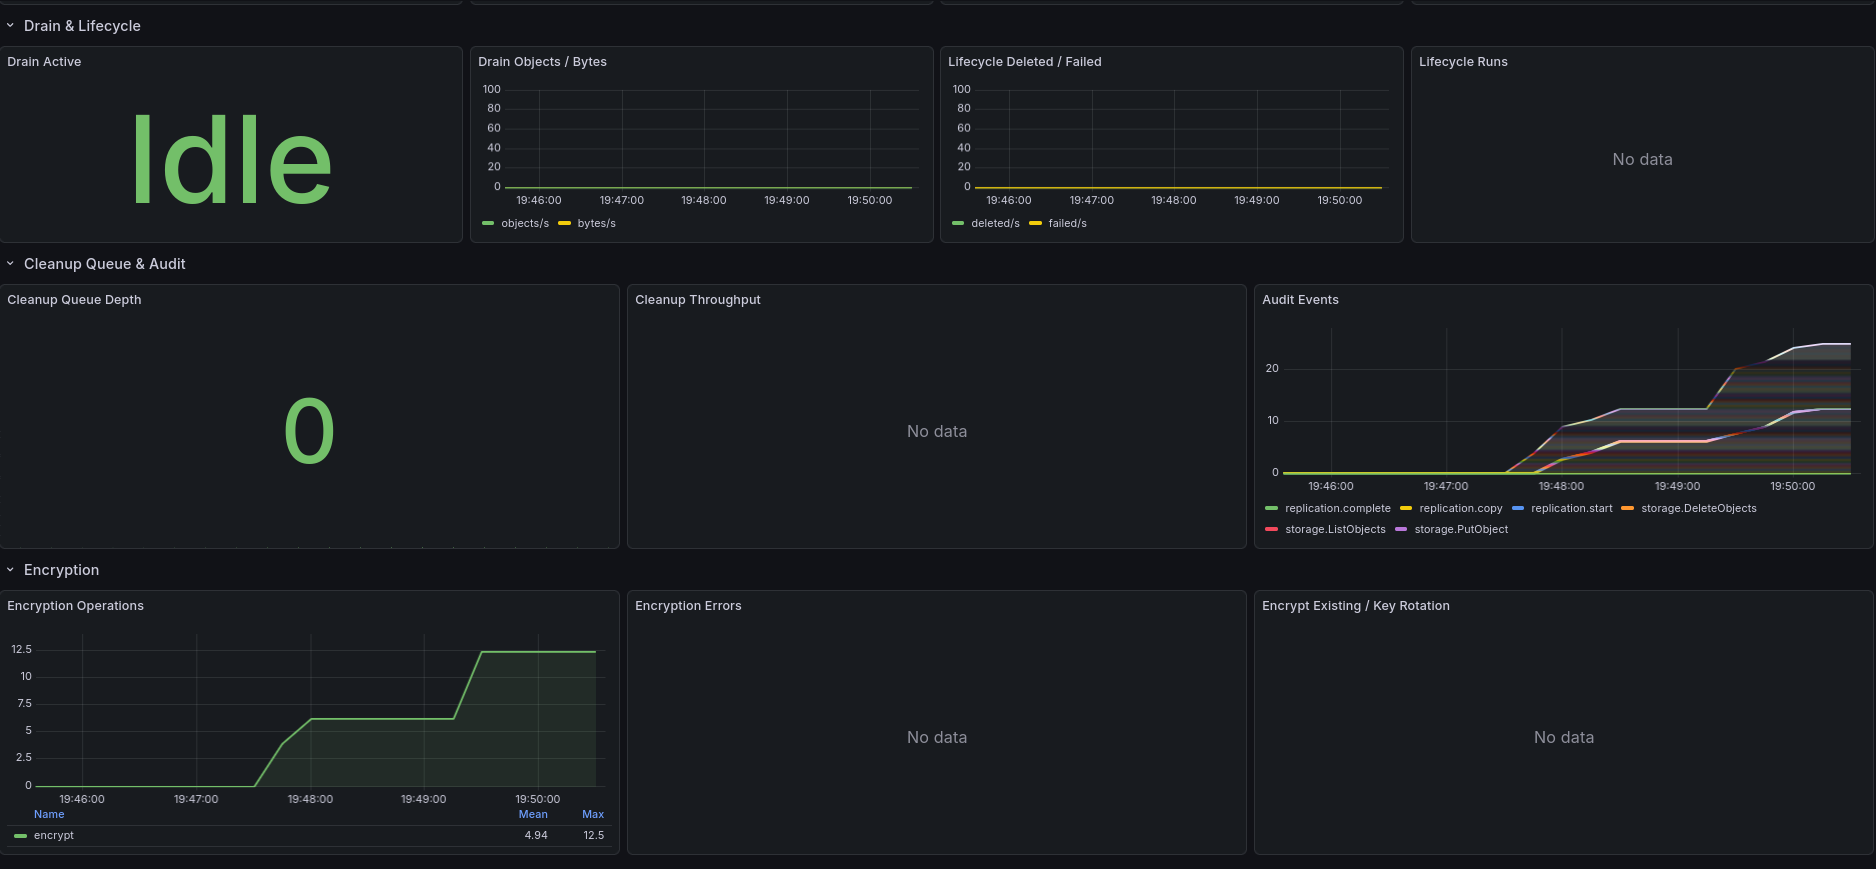
Drain, Lifecycle & Encryption
The bottom of the dashboard covers drain operations (active drains, objects and bytes moved), lifecycle rule enforcement (objects deleted, failed deletions, rule evaluation runs), and encryption metrics (encrypt/decrypt operations, errors, key rotation events).
Prometheus Metrics
The orchestrator exposes a Prometheus-compatible metrics endpoint at http://localhost:9000/metrics. Prometheus scrapes it every 10 seconds in the demo. To explore raw metrics, go to Explore in Grafana, select the Prometheus datasource, and browse the available metrics. All metrics are prefixed with s3o_ (a rename to s3_orchestrator_ is planned).
Distributed Tracing
Every S3 request generates an OpenTelemetry trace that flows to Tempo. Traced operations include S3 API requests, replication copies, rebalance moves, multipart cleanup, and cleanup queue processing.
In Grafana, go to Explore and select the Tempo datasource. The default view shows recent traces searchable by service name, duration, or status. Click any trace to see the full span waterfall — the request through the orchestrator, the backend storage operation, and any replication work it triggered.
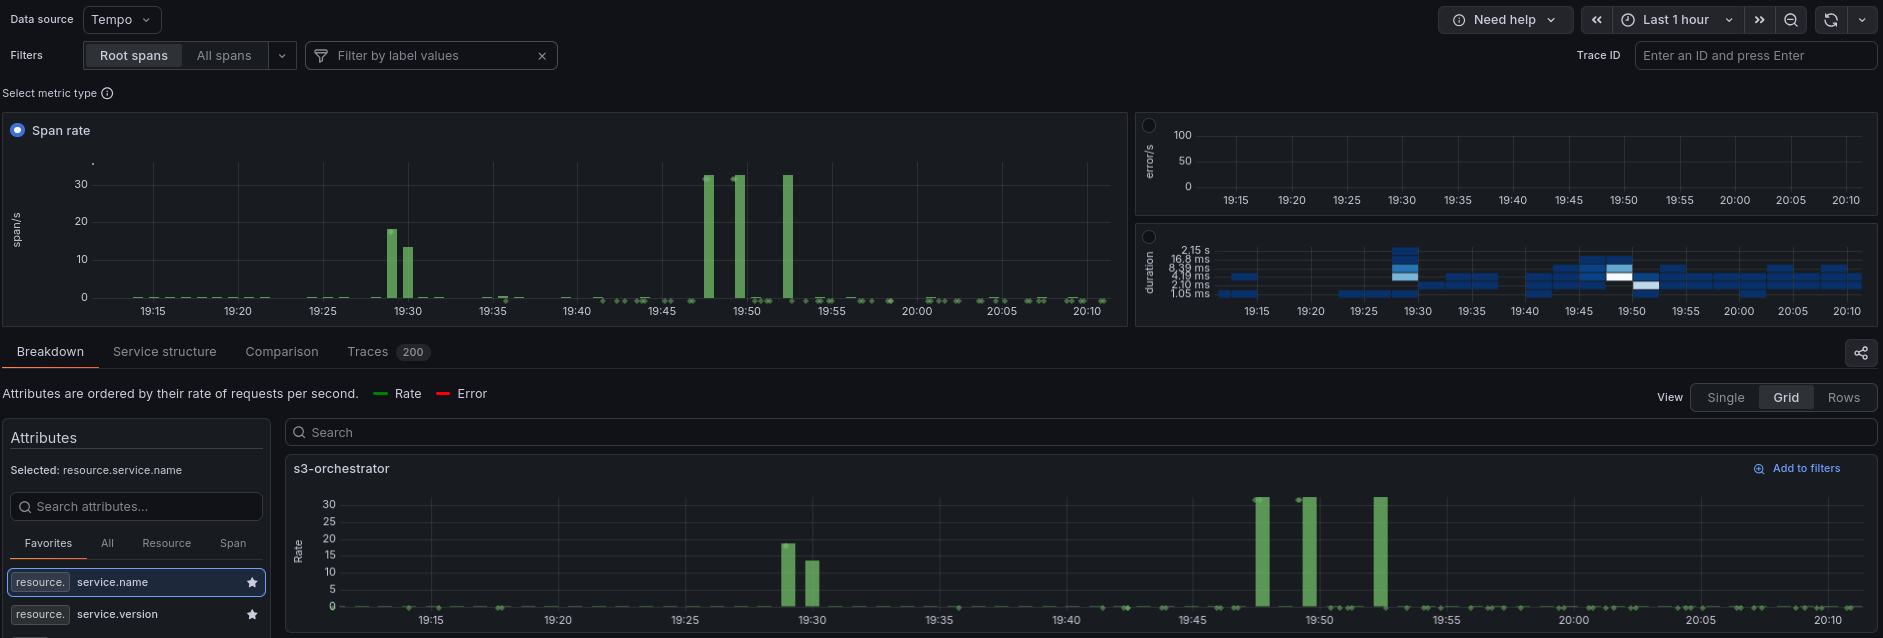
Tempo also generates a Service Graph from the trace data, showing s3-orchestrator and its connections to the storage backends. Click Service Graph in the Tempo explore view to see it.
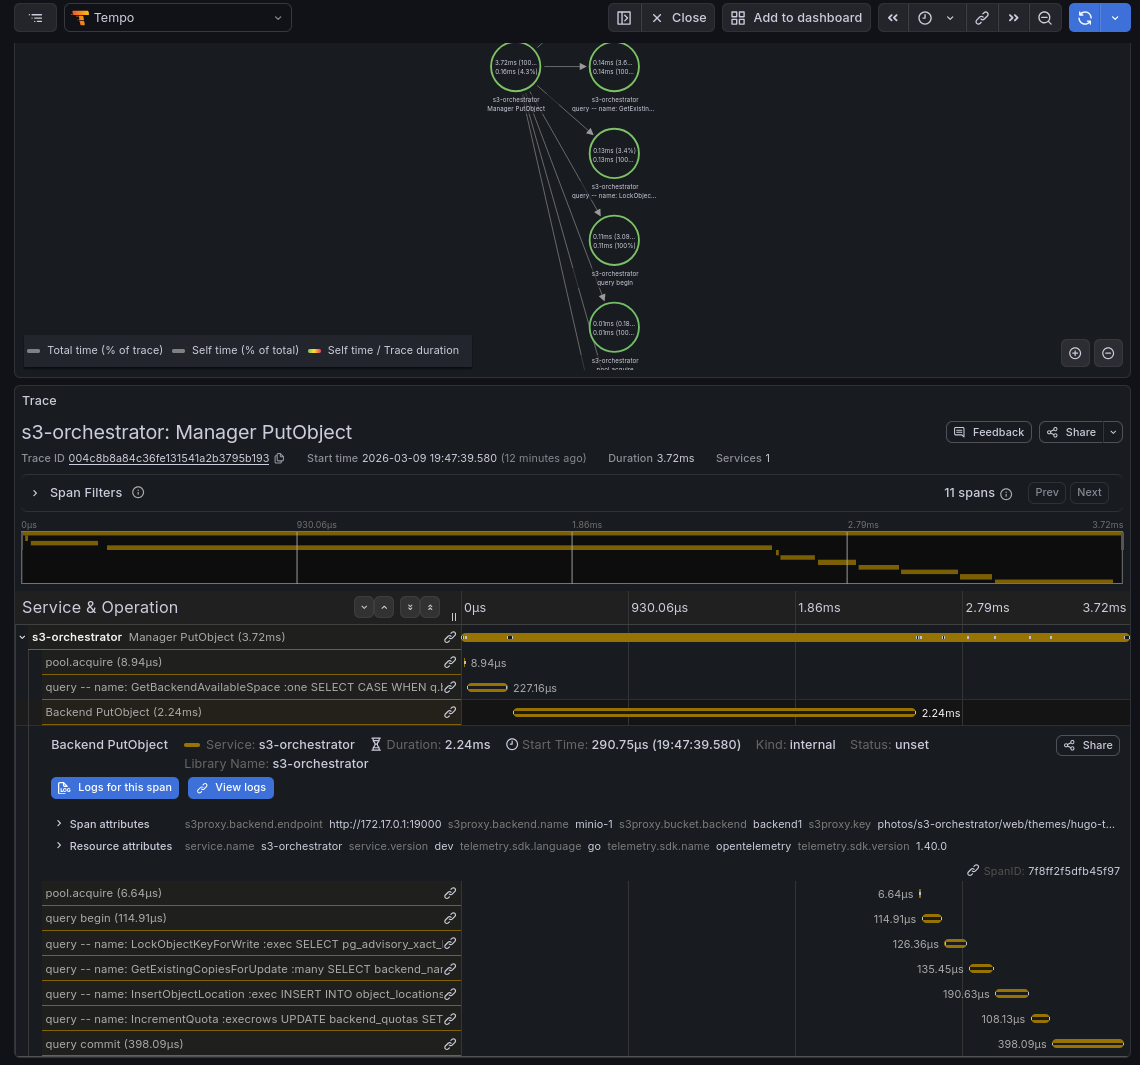
Click any node or edge in the service graph to jump to the underlying traces. Selecting an individual trace opens the span waterfall, showing the full request lifecycle — from the HTTP handler through backend storage operations and any replication work it triggered.
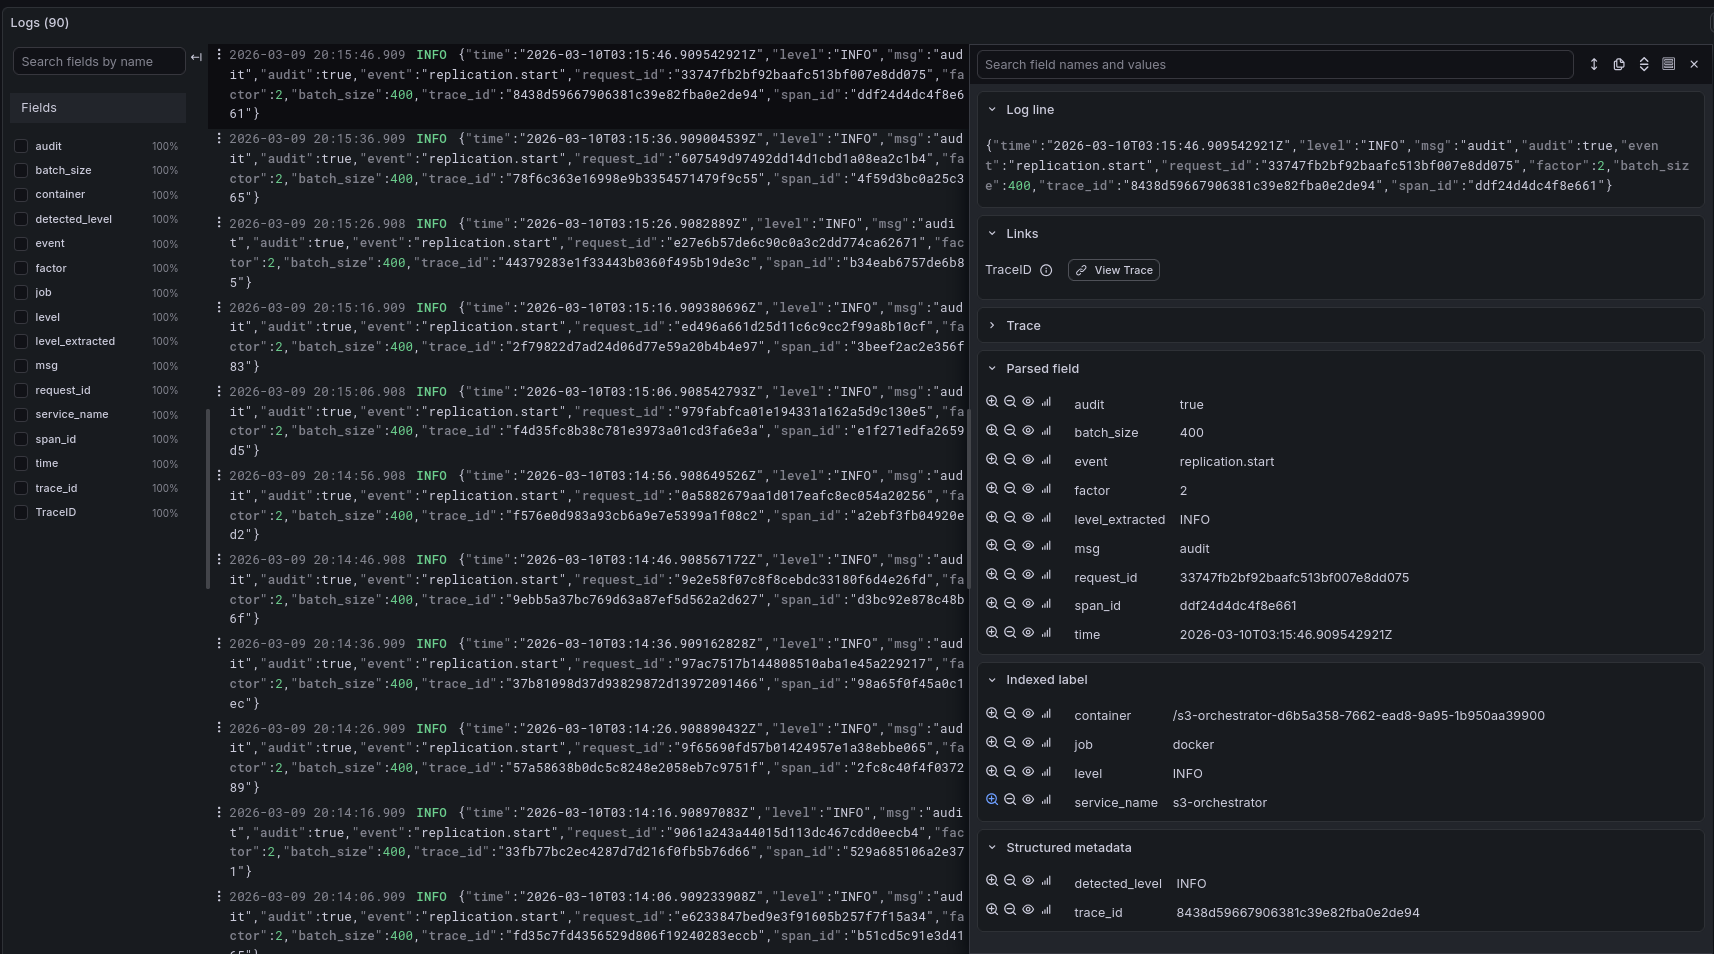
Log Exploration
Structured JSON logs are collected by Alloy and shipped to Loki. To explore:
- In Grafana, go to Explore
- Select the Loki datasource
- Run
{service_name="s3-orchestrator"}to see all logs - Filter by level:
{service_name="s3-orchestrator"} |= "ERROR" - Search for audit events:
{service_name="s3-orchestrator"} |= "audit"
Logs include structured fields like event, request_id, backend, key, size, and duration for audit trail and debugging.
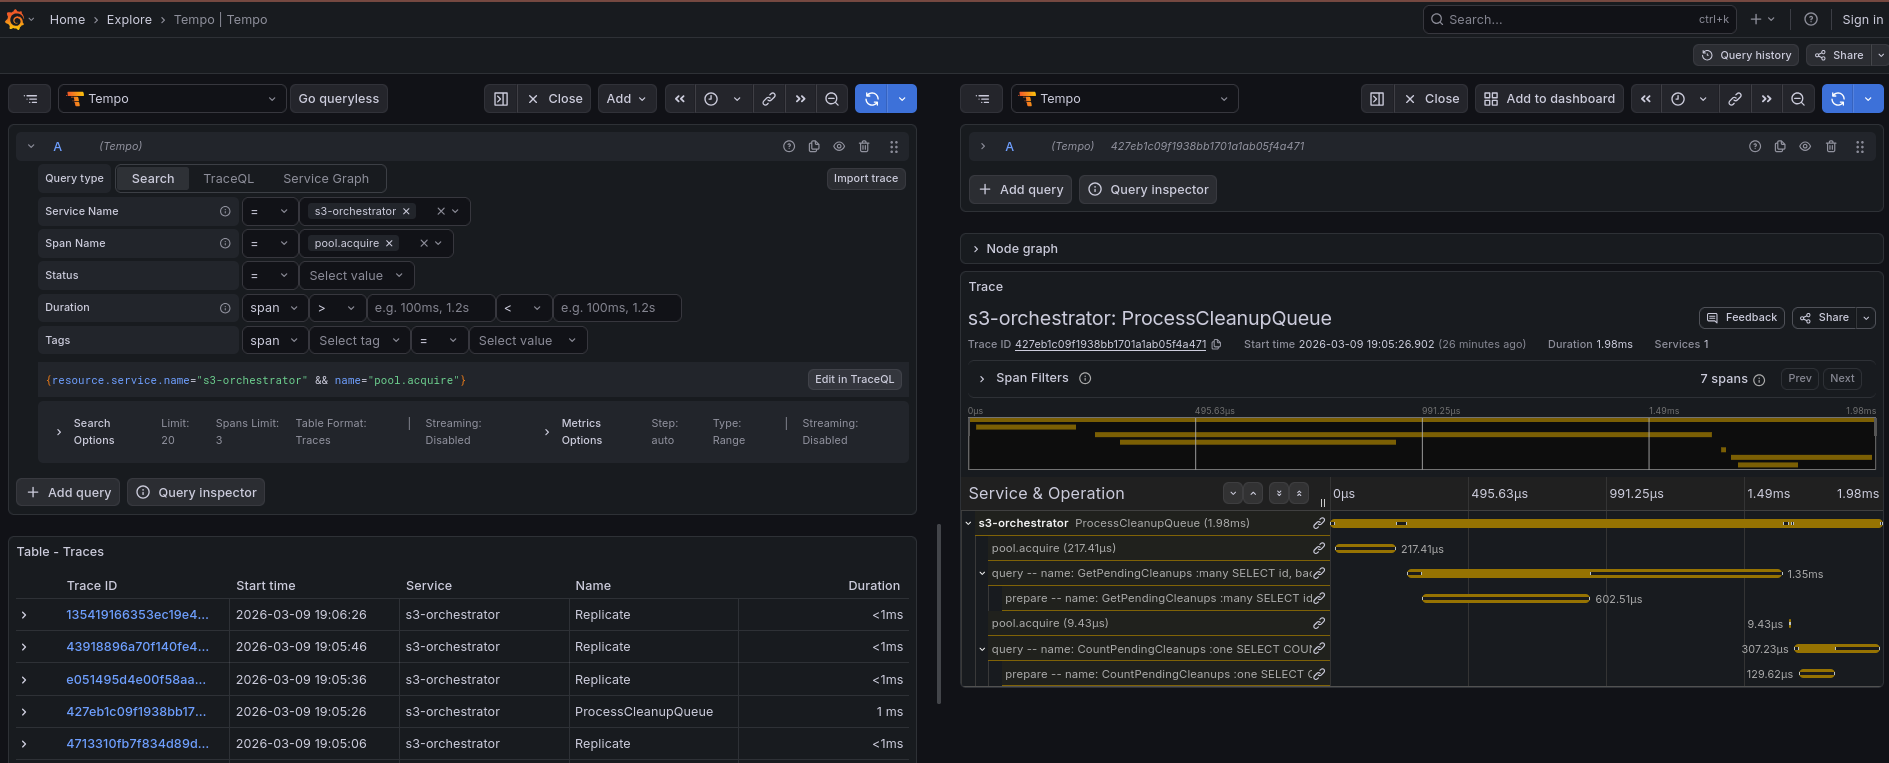
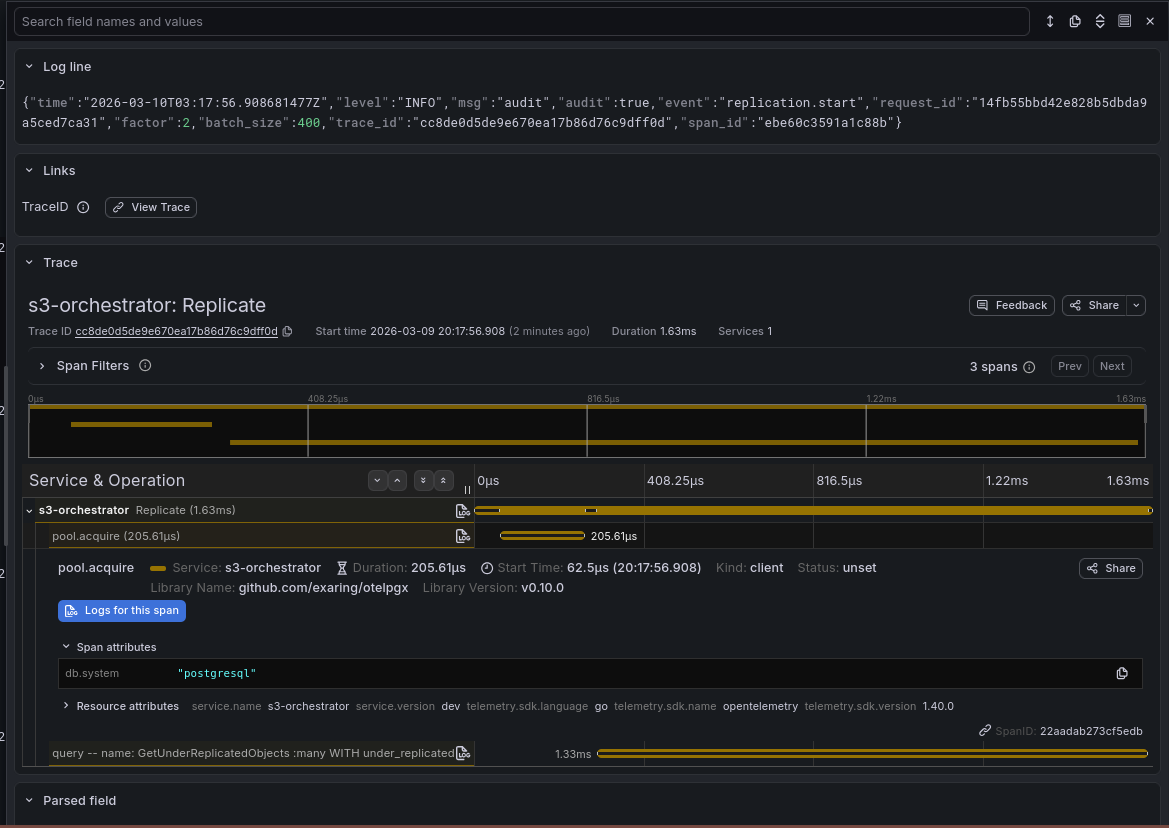
Trace-to-Log Correlation
Traces and logs are linked bidirectionally:
- Logs to traces — log entries that contain a
trace_idfield show a View Trace link. Click it to jump directly to the full trace in Tempo. - Traces to logs — when viewing a trace in Tempo, click View logs on any span to see the corresponding log entries in Loki for that trace.
This lets you start from either direction — find a slow trace and see what the application logged, or find an error log and see the full request lifecycle.
Experimenting
Here are some things to try:
Watch replication in action
Upload a file and check the Backends Table in the admin dashboard. You will see the object appear on one backend first, then on the second backend within a few seconds as the replication worker copies it.
Observe routing strategies
Upload several files and compare the storage distribution. The Nomad demo uses pack (fills minio-1 first, then minio-2, then minio-3), while the Kubernetes demo uses spread (distributes evenly across all three backends). The Grafana dashboard’s Quota & Storage section shows the difference clearly.
Trigger a rebalance
A rebalance redistributes objects according to the current routing strategy. It is useful when the routing strategy has changed or a new backend has been added — if objects are already where the strategy wants them, rebalance is a no-op.
To see it in action with the Nomad demo:
- Upload several files —
packrouting places them all onminio-1first - Edit the Nomad job to change the routing strategy to
spreadand redeploy - Click Rebalance in the admin dashboard
- Objects migrate from
minio-1tominio-2andminio-3until all backends are balanced - Watch the Rebalancer section in the Grafana dashboard to see objects and bytes moving
Test circuit breaker behavior
- Stop one of the MinIO containers:
docker stop s3-orchestrator-minio-1-1 - Upload a file — the orchestrator routes to the healthy backend
- Check the Circuit Breaker panel in Grafana to see the state transition
- Restart MinIO:
docker start s3-orchestrator-minio-1-1 - The circuit breaker resets after 15 seconds and the backend rejoins the pool
Explore encryption
Objects are encrypted transparently. To verify:
- Upload a file through the orchestrator
- Try reading it directly from MinIO at
http://localhost:19000— the content is encrypted ciphertext - Read it back through the orchestrator at
http://localhost:9000— it is decrypted automatically
Tearing Down
This stops the orchestrator, deletes the Nomad job or k3d cluster, and tears down all Docker Compose services.